Madhavi Nithianandam

Senior QA professional with hands-on experience in AI/ML development and data analytics, combining a strong quality mindset with model development, evaluation, and optimization. Skilled in data preprocessing, visualization, and testing AI systems for accuracy, reliability, and performance.
Earned AI certification from Case Western Reserve University
View My LinkedIn Profile
Selected projects in Data Science, Machine Learning, Deep Learning and Transformers
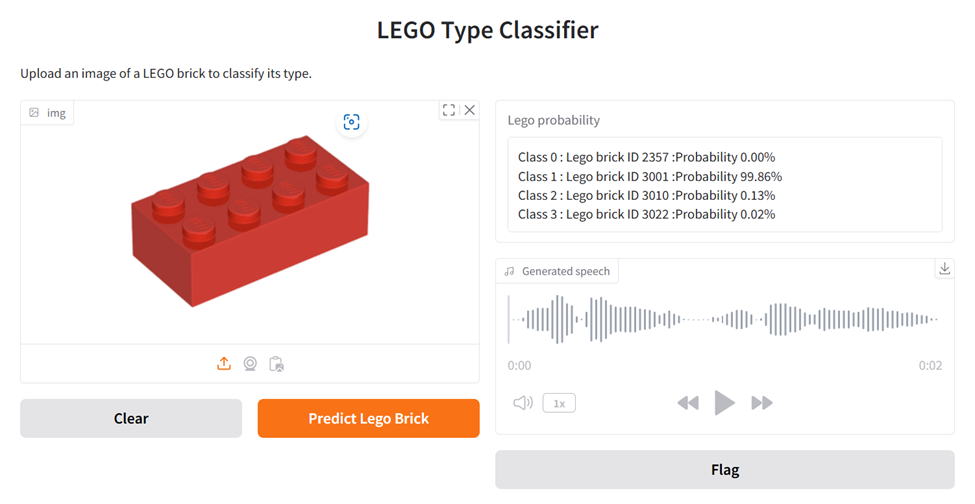
AI powered Lego image classifier
A CNN based lego image classification model built using Tensorflow / Keras integrating Gradio UI and OpenAI Text-To-Speech for interactive user feedback. This project involves data preparation, data pre-processing, data augmentation, model training, model optimization, and model evaluation
Image Pre-processing [Resizing, Edge detection, Padding]
Image prediction
Interactive Gradio Interface
NLP Transformer Application Suite – Hugging Face
Built a complete suite of Natural Language Processing (NLP) applications using state-of-the-art Hugging Face Transformer models. This project demonstrates a practical understanding of modern transformer-based NLP techniques. Using Python and Hugging Face Transformers, I implemented applications for:
🌍 Language Translation
✨ Text Generation
❓ Question Answering
📝 Text Summarization
Interactive Gradio Interface

H5N1 Outbreak Risk Classifier
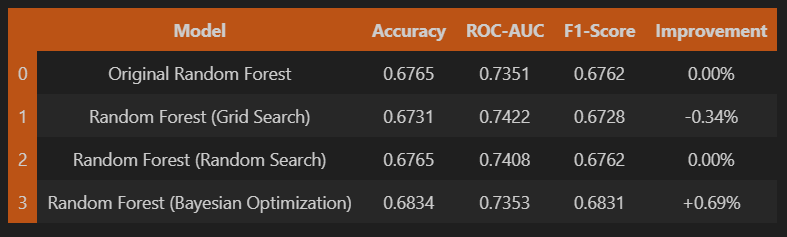
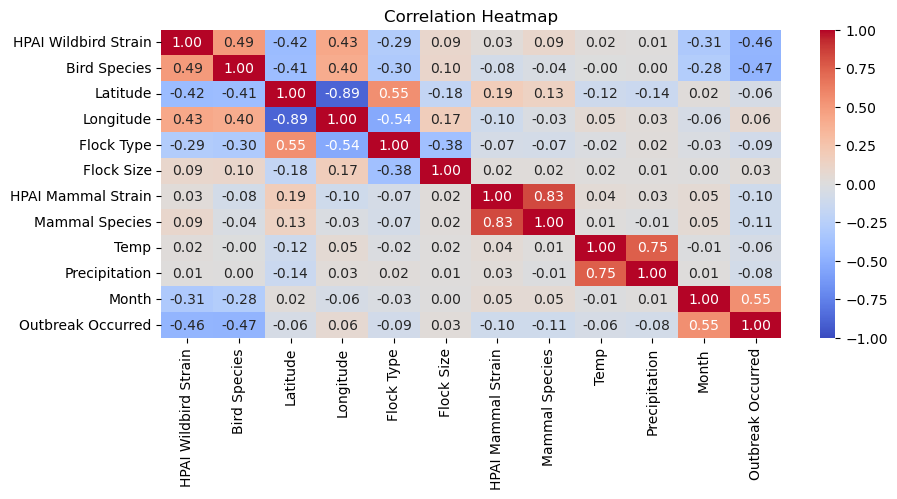
Developed a machine learning model to predict H5N1 bird-flu outbreaks. Team project; my contributions focused on binary classification (Random Forest, Logistic Regression), plus data cleaning, processing, visualization, model training, and hyperparameter tuning.
Hyperparameter tuning:
Correlation Heatmap
Monthly Distribution of Outbreaks:

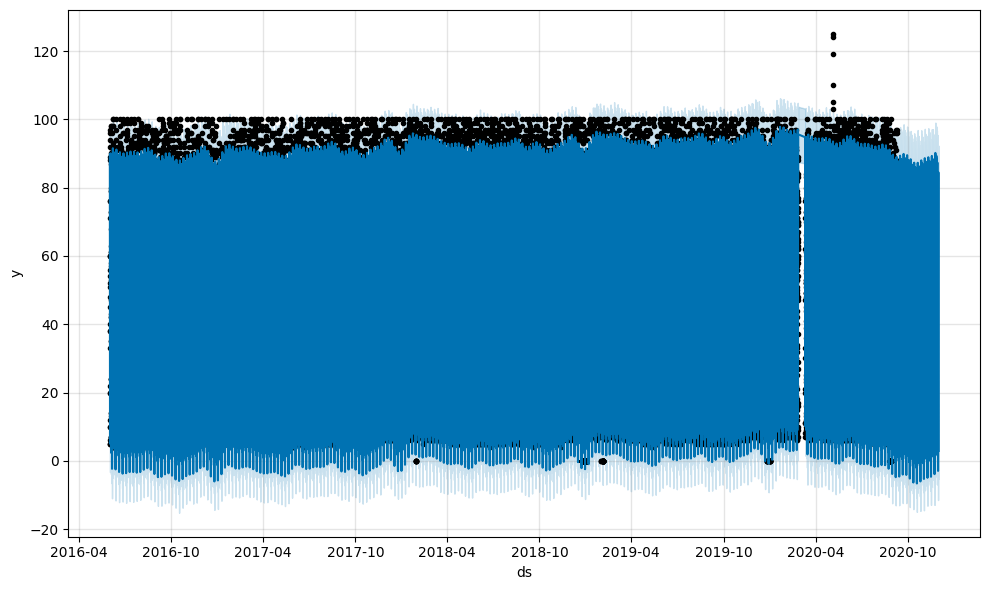
Time Series forecasting with Prophet
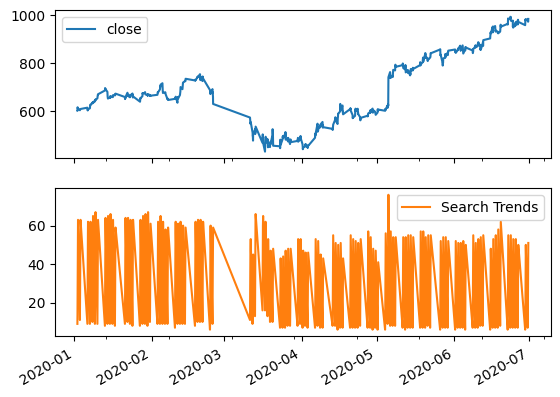
This project explores whether search-traffic trends can offer predictive value for trading Mercado Libre (MELI) stock. Using time-series analysis on financial data and user search volumes, the analysis identifies correlations, leading indicators, and lag patterns to determine if increases in search interest translate into meaningful changes in stock price or volatility. The project applies forecasting models and statistical techniques to evaluate the potential of search-based signals as a trading strategy.
Stock closing price vs Search Trend Data
Prophet forecasting plot
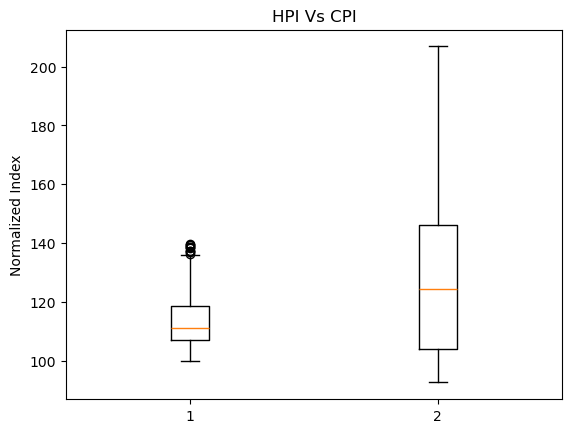
Exploratory Data Analysis (CPI–HPI Trends)
Conducted an exploratory data analysis on how inflation relates to housing, unemployment, and the stock market. Led the CPI–HPI track. Cleaned and joined monthly time series, visualized trends and examined outliers.
Box Plot
Scatter Plots

